Take your baking skills to the next level with these helpful, easy-to-read charts. From frosting flavors to the perfect chocolate chip cookie, these handy graphics can serve as a reference for you in the kitchen.
1. The Perfect Chocolate Chip Cookies
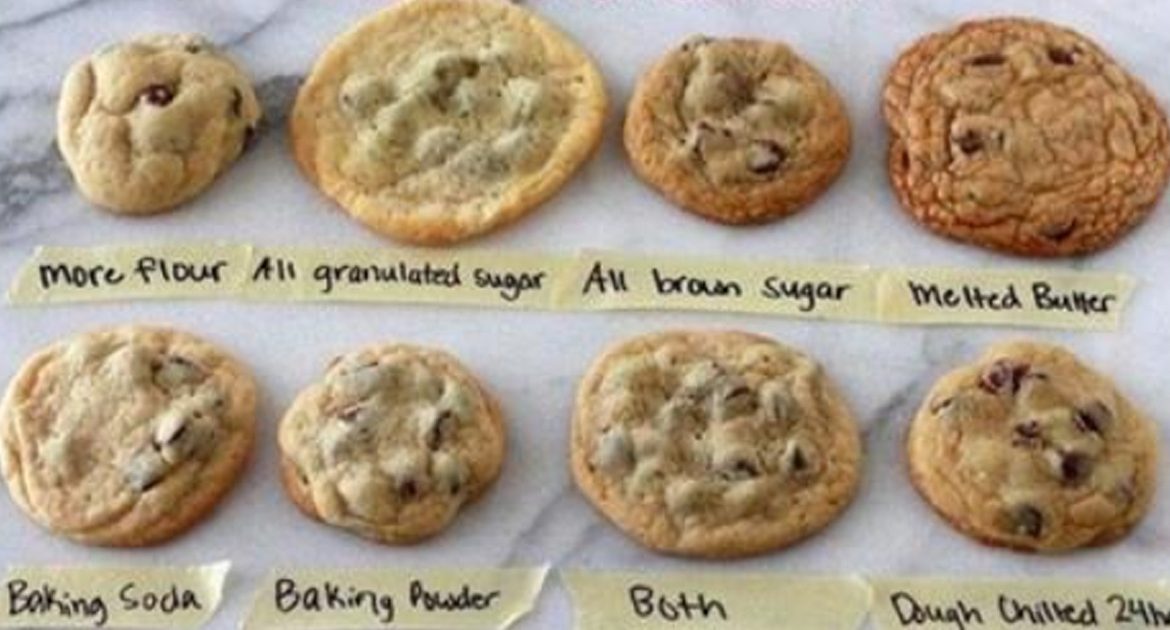
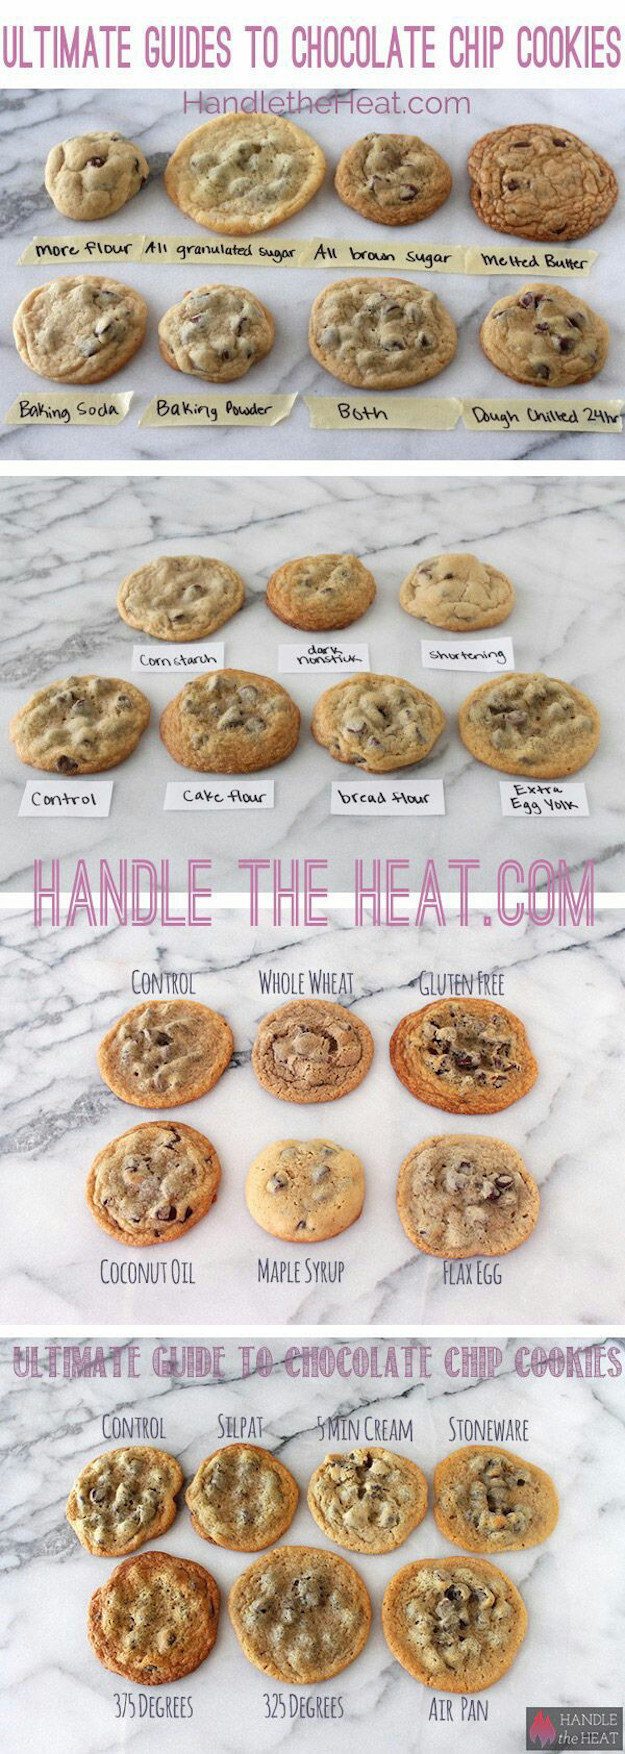
If you’ve ever baked a batch of chocolate chip cookies, only to have them turn out flat or crumbly, look no further. The folks over at Handle the Heat created this nifty chocolate chip cookie guide that explains why there’s such variation. Melted butter produces cookies with shiny, crackled tops and crisp edges, while all brown sugar produces an intense butterscotch flavor.
2. Baking Conversion Chart
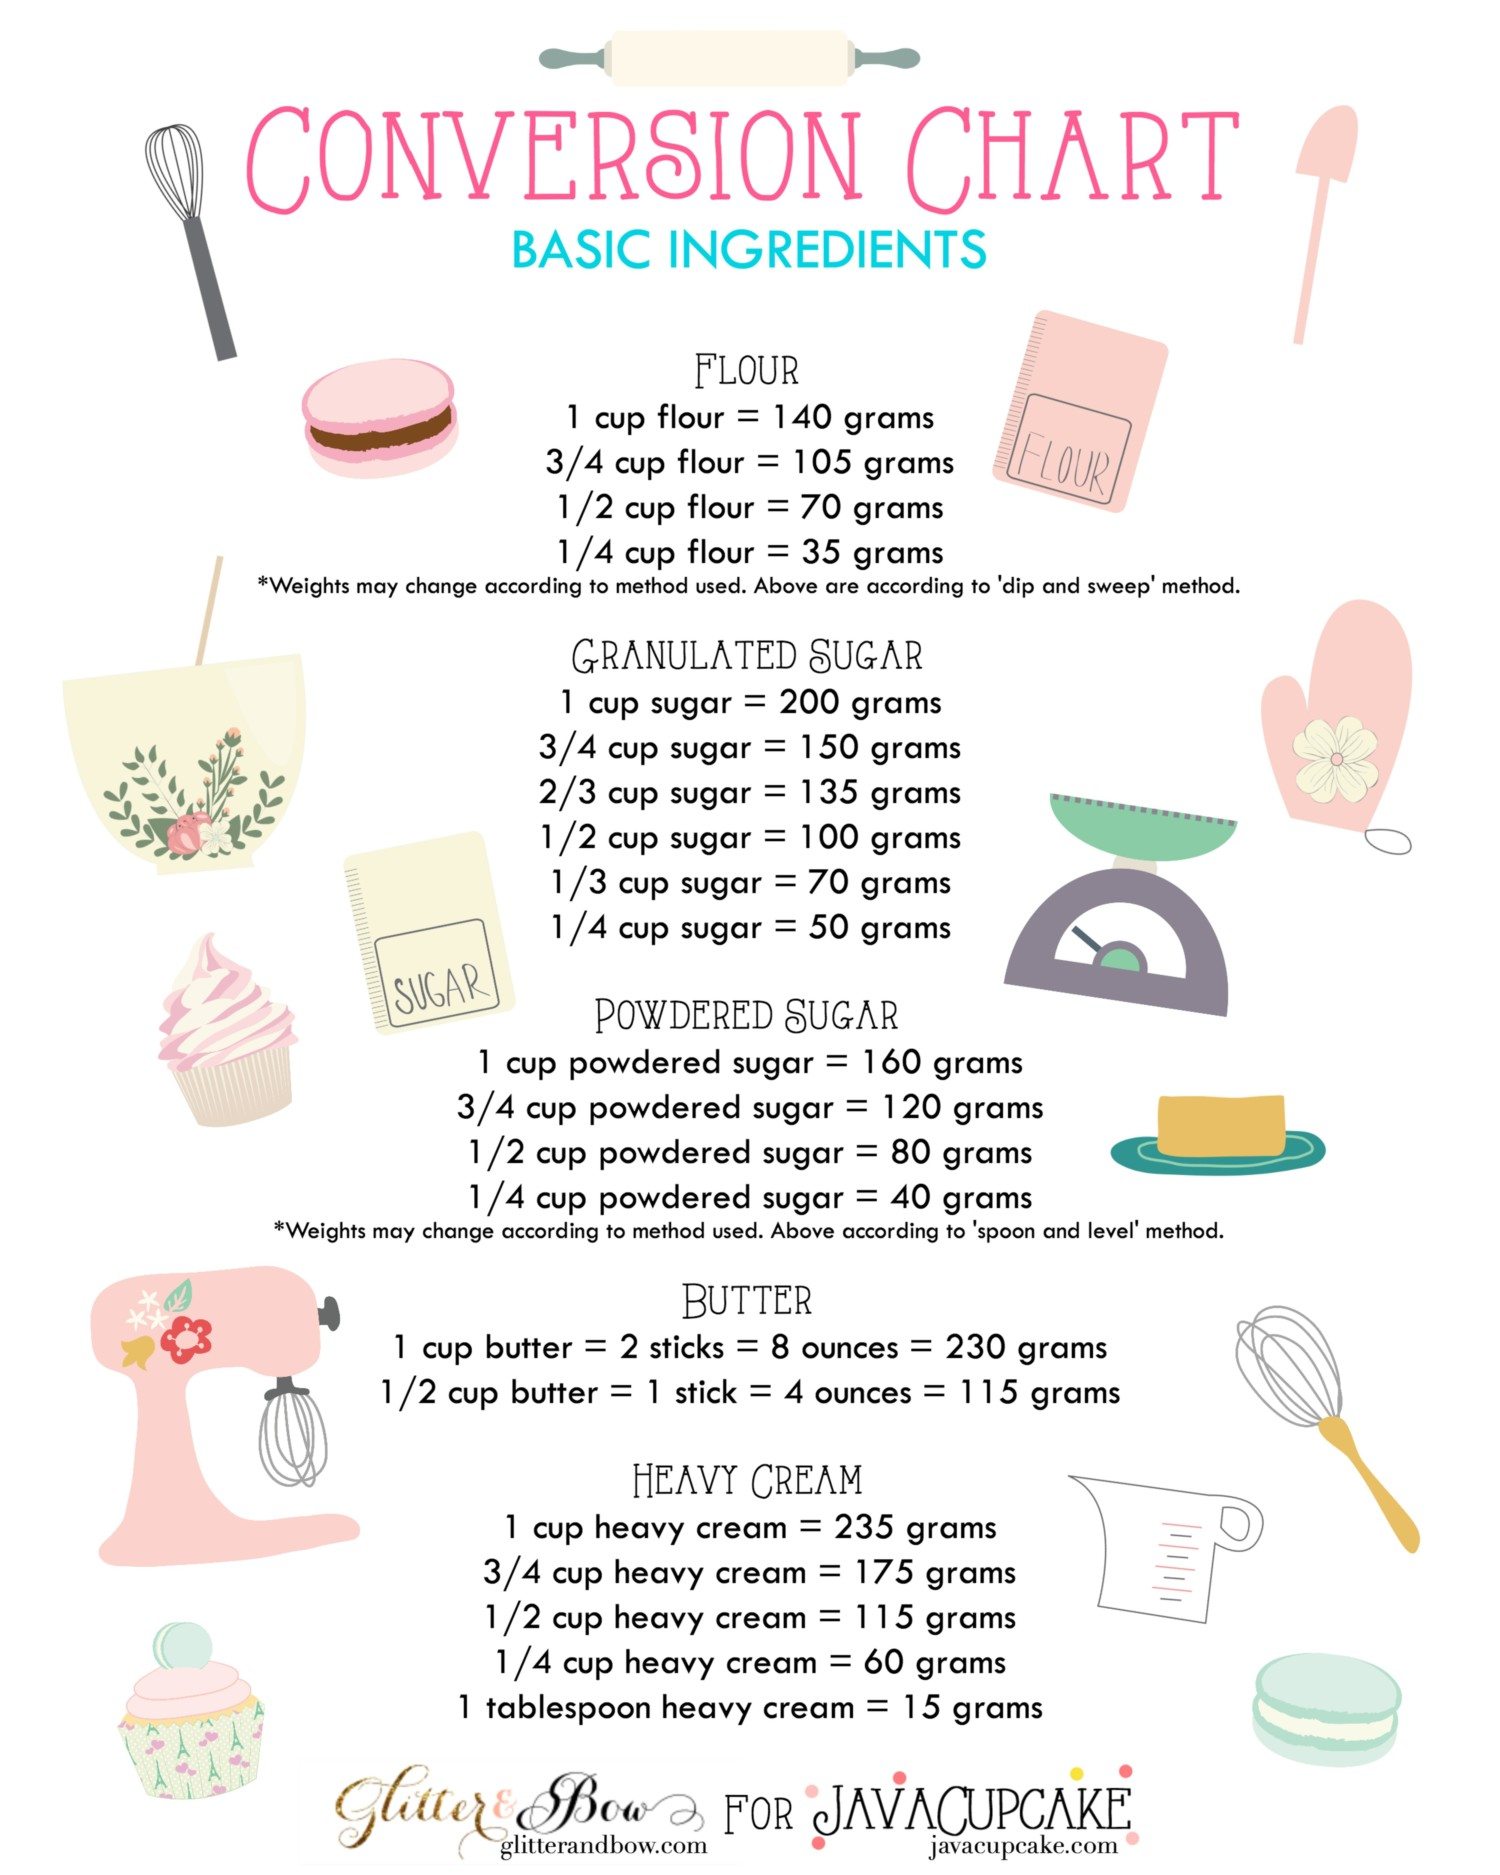
It pays to be precise when you’re baking. If you follow food bloggers from other parts of the world, this chart from The Java Cupcake can help you decipher metric measurements for flour, sugar, butter and cream.
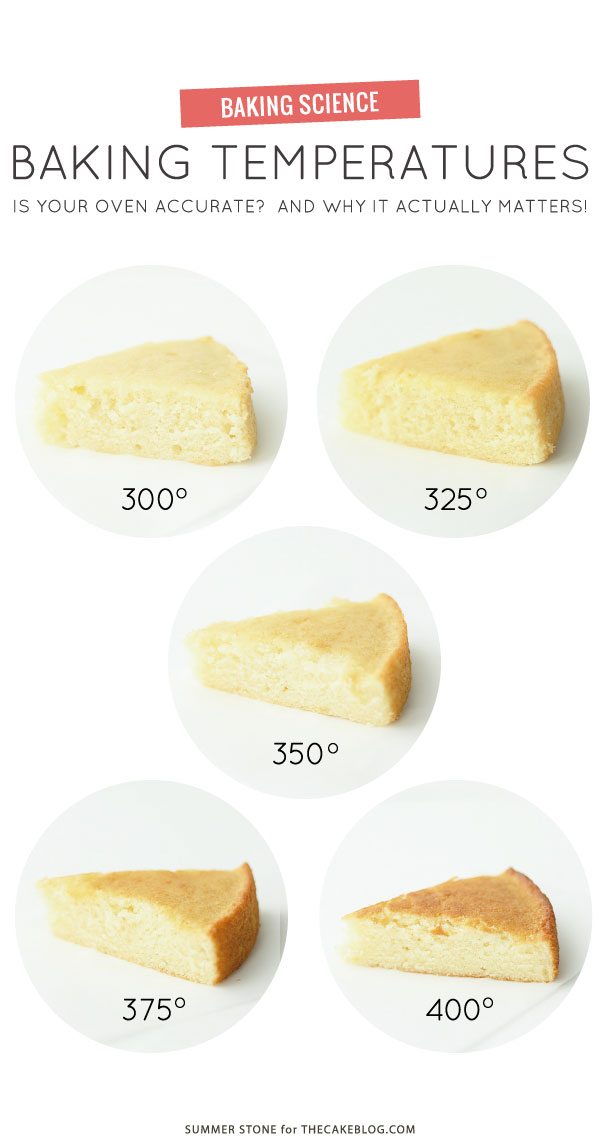
3. Baking Temperature Comparison
One of the keys to baking the perfect cake is oven temperature. Summer Stone at The Cake Blog baked a handful of cakes at various temperatures to demonstrate the difference a few degrees makes. Her chart shows the difference between a cake baked at 300 degrees (light, fluffy with a pale outer crust) and one baked at 400 degrees (dark outer crust, rougher texture).
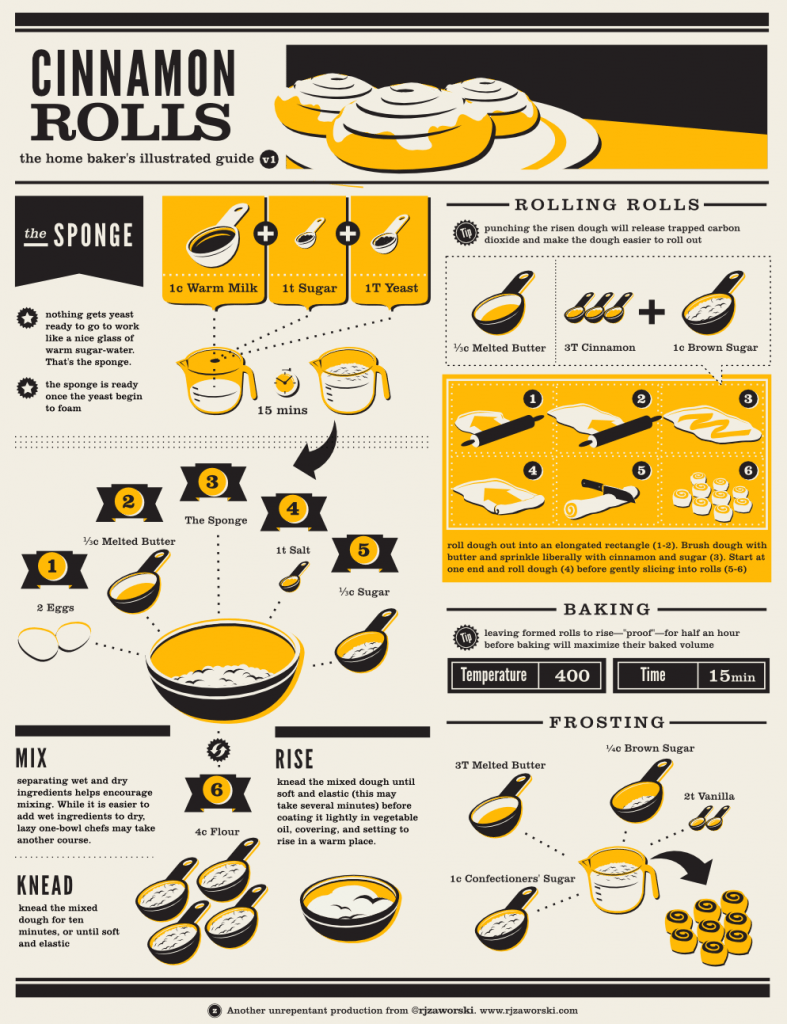
4. Guide To Baking Cinnamon Rolls
Here’s an easy way to impress your friends or your significant other at breakfast: homemade cinnamon rolls. And with this handy chart from Rj Zaworski, you’ll never go back to the pre-made rolls from a tube!
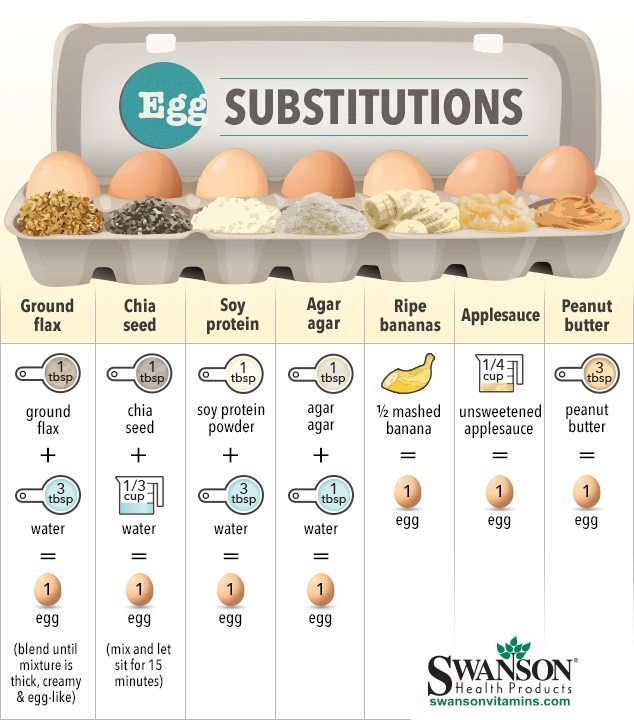
5. Egg Replacement Chart
There are a number of ingredients you can use to replace eggs in your recipes, including peanut butter, banana and applesauce. Going vegan, or simply cutting eggs out of your diet, doesn’t mean you have to stop baking, according to Swanson Health Products.
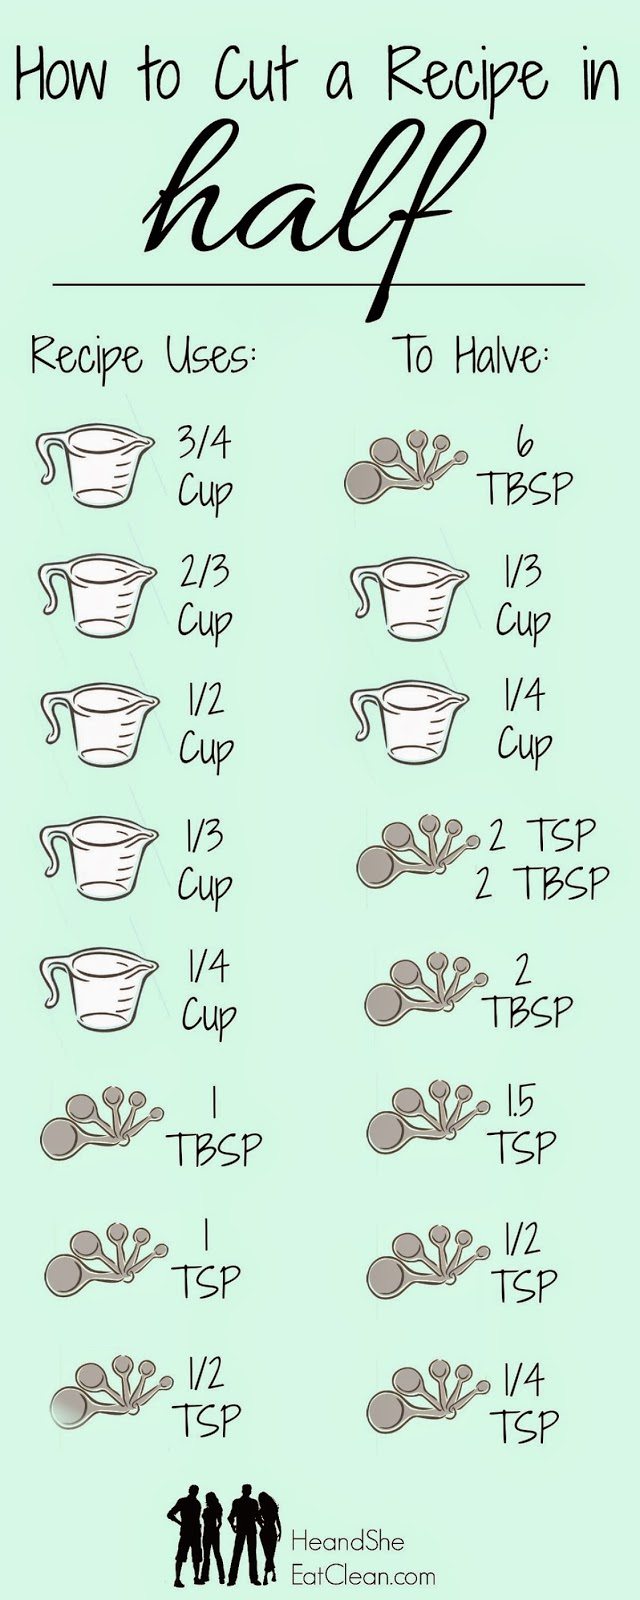
6. Cut A Recipe In Half
It sounds simple enough, but cutting a recipe in half sometimes proves difficult. If you get tripped up on the conversion between cups, tablespoons and teaspoons, this chart from He and She Eat Clean can help.
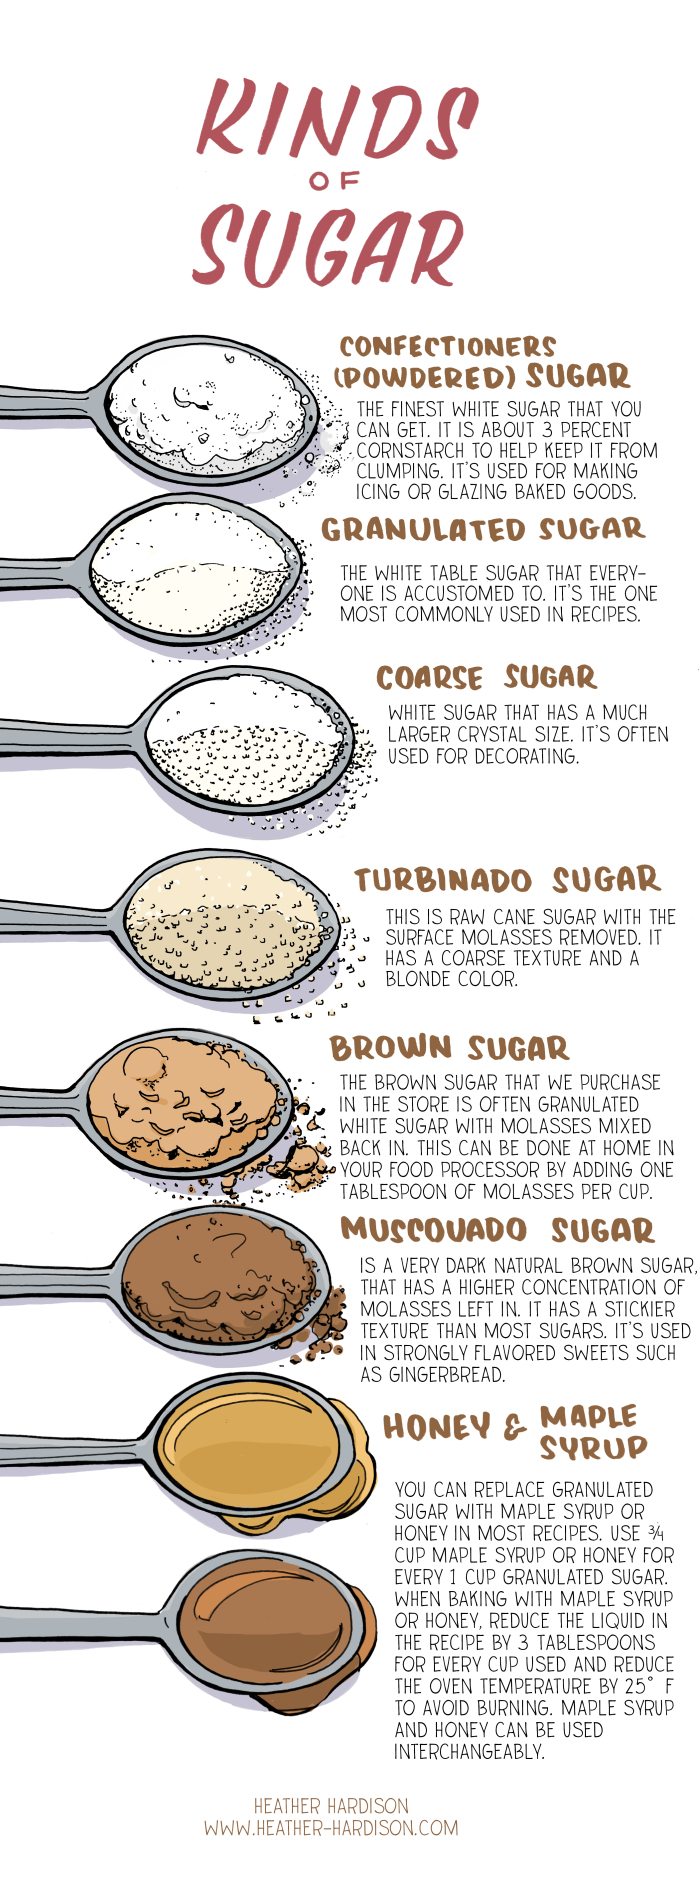
7. Types Of Sugar
This chart from Illustrated Bites is super useful if you’re curious about all the types of sugar you’ll encounter when baking. Learn about muscovado sugar, which is used in most gingerbread recipes, and maple syrup, which can be used as a replacement for granulated sugar.
8. Apple Pie
The smell of homemade apple pie wafting through the house is irresistible. Louise Swindells will show you how to make one from scratch with this artful collection of photographs and instructions. If you’re a visual learner, this is the recipe you should follow!

9. Lattice Pie Crust
Ever wondered how bakers make those perfectly symmetrical lattice pie crusts? Ali Ebright at Gimme Some Oven has a really straightforward chart that shows the surprisingly simple process for creating this classic checkered pattern with pie dough. “Once you have the strips of dough cut out, it really just takes a minute or two to lay out the pattern, and then pinch the edges together to make your crust,” she writes.

10. Science Of Baking
If you want to nerd out a little bit while baking, this chart from Shari’s Berries has some pretty great info on the magic—aka science—that happens when you pop a cake into the oven. This chart covers everything from flour to shortening to salt.

11. Frosting In Every Color
Not only is this rainbow chart easy on the eyes, it’s also super useful. Go beyond the standard red, blue, green and yellow food coloring in your pantry to create more nuanced shades, such as dusty rose, green apple and apricot. Use this McCormick guide to make unique frosting and cake colors and flavors.

